Plot Widget
hardware_control.gui.widgets.plot module
- class hardware_control.gui.widgets.plot.MiniPlotTool(app, name='Mini Plot', width=100, height=100, **kwargs)
Bases:
PlotBaseA no-frills matplotlib figure.
These objects contain neither axes nor labels. They merely consist of a small window that can be included, for example, in a status bar.
- update()
Update the plot widget with the most recent data.
- class hardware_control.gui.widgets.plot.PlotBase(app, name: str = '', width: int = 500, height: int = 500, active_update: bool = True, time_zone: str = 'America/Los_Angeles', dpi: int = 100)
Bases:
QWidgetBase class for plotting widgets to display measured data.
- set_dataset(dataset_name: str)
Specify which dataset the widget should display.
- Parameters:
dataset_name (str) – Name of dataset to display
- toggle_autoscale()
Toggle the autoscale function.
The autoscale function will automatically adjust the axes to fit the data. This function toggles the autoscale function on and off.
- toggle_normalize()
Toggle the normalize function.
The normalize function will automatically normalize the displayed data to have a maximum value of 1. This allows parameters of greatly different magnitudes to be viewed easily on the same chart. This function toggles the normalize function on and off.
- update()
Update the plot with new data.
Handles autoscaling, normalizaiton, and data plotting.
Should be called via super() from the class that inherits from PlotBase. self.plot.draw() also needs to be called.
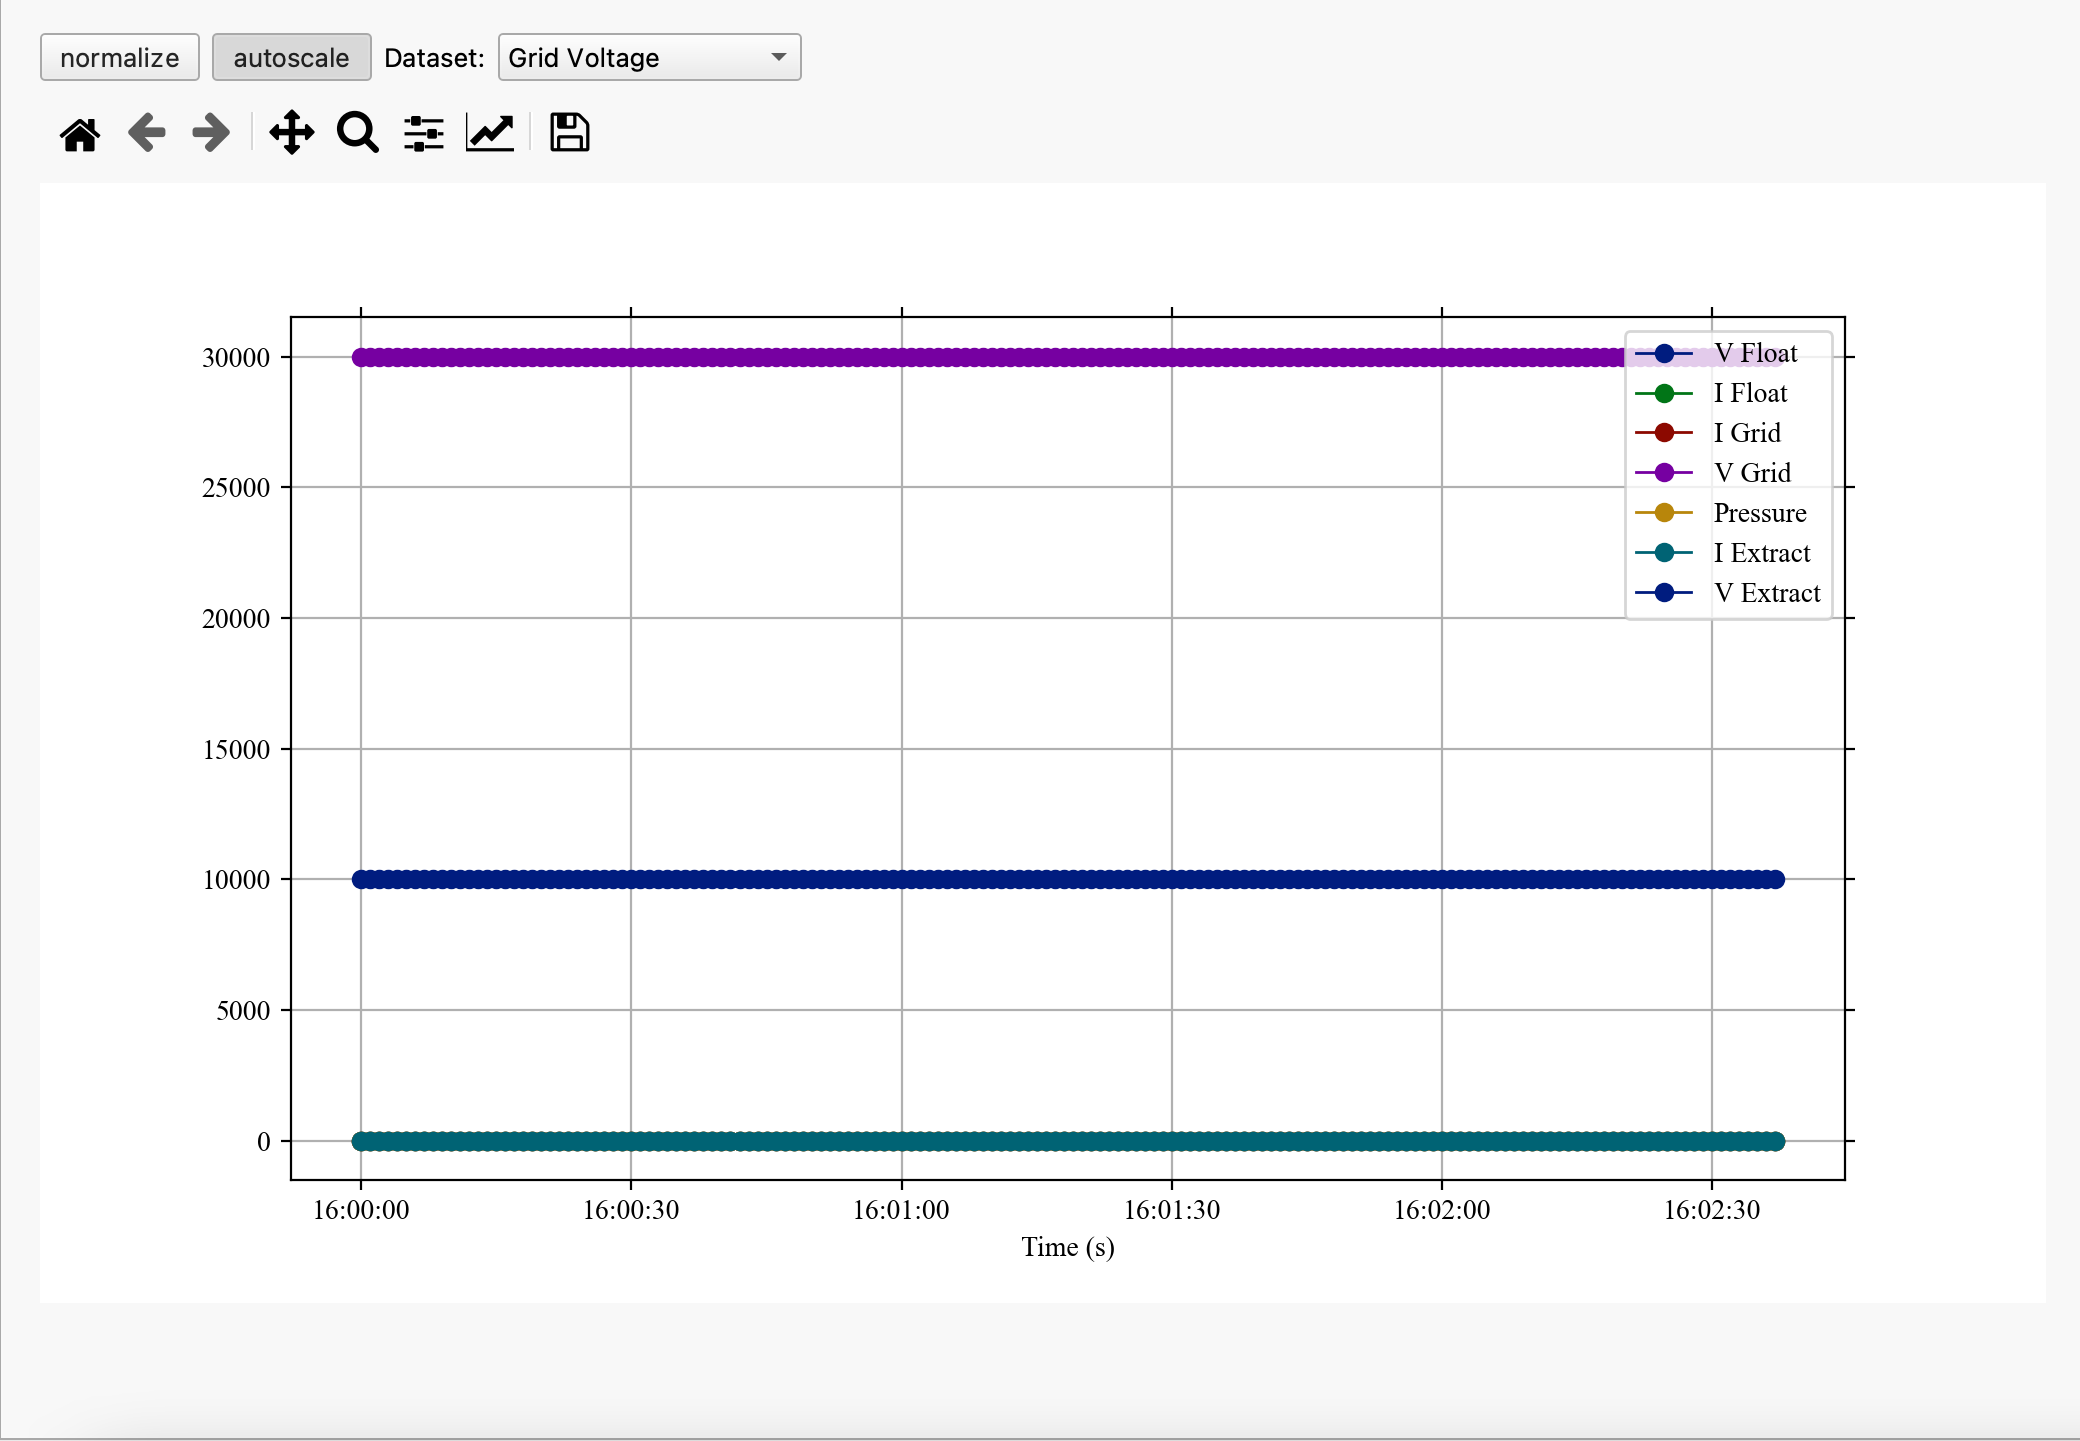
- class hardware_control.gui.widgets.plot.PlotTool(app, name: str = 'Plot Tool', skip_datasets: List[str] | None = None, **kwargs)
Bases:
PlotBaseA single matplotlib figure with normalize and autoscale buttons.
- selector_changed()
Update the dataset to plot using the current dataset in the dropdown.
This function is called automatically when the dataset dropdown is changed.
- set_dataset(dataset_name: str)
Specify which dataset the widget should display.
- Parameters:
dataset_name (str) – Name of set in hc.App to plot
- update()
Update the plot widget with the most recent data.